
If you’re an actual Trader, you must have run into the pitfall of recognizing a change in momentum and change in trend at the same time. Timing the market is a tough one. Yet, it gives a helping hand in taking better decisions using tools like a stochastic oscillator.
The stochastic oscillator is one of the most popularly used momentum indicators. It enables an overall evaluation of overbought and over-sold conditions. The stochastic index could offer great success if you are trading stocks, forex, commodities, or crypto.
In this guide, you’ll learn:
- The stochastic oscillator formula and how it operates
- The stochastic indicator’s proper settings for certain market scenarios
- Stochastic divergence is not only a reliable way of confirmation signals, but also security in making transaction decisions
- A stochastic strategy that combines stochastics with other indicators will ensure you have high-profit trades
In the end, you will be able to follow how you can engage this powerful tool into your trading style and enhance your performance.
What is the Stochastic Oscillator?
Stochastic Oscillator has been at a glance. It is a measure of speed of change in prices over time. It helps the traders to identify overbought/oversold conditions in the market for a price reversal.
The concept of the stochastic oscillator given by George Lane happened to be twofold. One feature is that price always comes after momentum. Therefore, for a trader, the momentum is an advanced price signal. Using the stochastic oscillator, the trader can follow the trend for an expected market reversal.
The Key Components of Stochastic Indicator:
- %K line-The line representing price.
- %D Line-smoothened moving line of the %K line.
- 80+ Overbought price levels. A price would change upwards.
- 20-below Oversold price levels price would go further high.
- The %K intersecting above %D gives a bullish buy signal.
- The %K crossing below the %D gives a bearish sell signal.
These give advantage over all other technical indicators: as it is the most powerful and effective tool in the arsenal.

Stochastic Oscillator Formula
The stochastic formula controls a stochastic oscillator. It evaluates the momentum price against a certain period.
%K = (Current Close − Lowest Low) / (Highest High − Lowest Low) × 100
%D = Simple Moving Average of %K(3−period SMA)
Where:
- Current Close = Closing price for current time period
- Lowest Low = Lowest price of past 14-time periods
- Highest High = Highest price of past 14-time periods
An Example of Calculation
In a period of 14 days, the highest price is ₹100 and the lowest price is ₹80, then the most recent closing price will be ₹90, so,
%K = (90-80) / (100-80) × 100 = 50
A %K of 50 means that the price is held in the middle range for the past 14 days between high and low.
How to Utilize the Stochastic Indicator in Trading
1. Acknowledging states of ample buying and selling
- When the %K crosses more than 80, the asset is extensively bought, thus a possible sell signal.
- When the %K crosses below 20, the asset is oversold, thus a possible buy signal.
2. Use Crossover Signals
- Buy Signal: This occurs when the %K crosses above the %D in the extensive selling area (when <20).
- Sell Signal: This occurs when the %K crosses below the %D in the overbought area (when >80).
3. Using Stochastic Divergence
Divergence occurs when price and stochastic move in contrary ways:
- Bullish Divergence: Price makes lower lows but Stochastic makes higher lows → Buy signal.
- Bearish Divergence: Price makes higher highs but Stochastic makes lower highs → Sell signal.
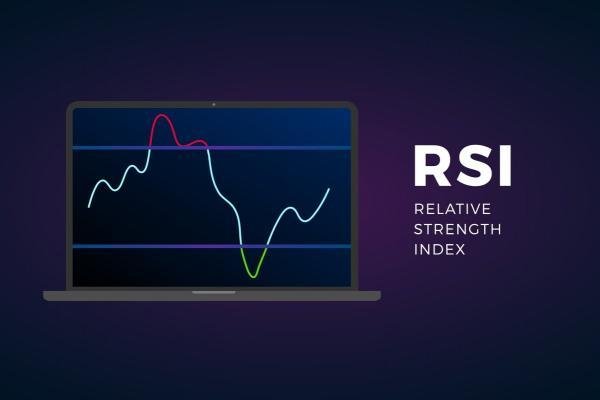
Stochastic RSI Indicator: A More Sophisticated Way
The stochastic RSI indicator runs the stochastic formula over the Relative Strength Index (RSI), unlike price.
Why do we Use Stochastic RSI?
- More reactive to price activity than standard stochastic
- Ideal for high-volatility markets such as forex and crypto
- Greater number of signals for active trader types
Reading Stochastic RSI
- Overbought (above 80): RSI is high and momentum can be decreasing
- Oversold (below 20): RSI is low, and price has the potential to bounce
Optimal Stochastic Indicator Settings for Different Markets
Not everyone needs to apply the default 14-period stochastic settings. These are suggested settings:
| Market | %K Period | %D Period | Overbought | Oversold |
| Stocks (Swing Trading) | 14 | 3 | 80 | 20 |
| Forex (Day Trading) | 8 | 3 | 8 | 15 |
| Crypto (High Volatility) | 5 | 3 | 90 | 10 |
| Commodities (Long-Term) | 21 | 5 | 80 | 20 |
Tip: Shorter periods (5 or 8) react faster, while longer periods (21) smooth out noise.

Formulating a Stochastic Strategy for Profitable Trading
The optimal stochastic strategy is the combination of stochastic oscillator signals with other indicators.
1. Stochastic + Moving Averages
- Buy when %K crosses above %D AND price is above 50-day moving average.
- Sell when %K crosses below %D AND price is below 50-day moving average.
2. Stochastic + MACD
- Buy when stochastic is oversold (<20) AND MACD crosses bullish.
- Sell when stochastic is overbought (>80) AND MACD crosses bearish.
3. Stochastic + Bollinger Bands
- Buy when stochastic is oversold AND price touches the lower Bollinger Band.
- Sell when stochastic is overbought AND price touches the upper Bollinger Band.
Common Stochastic Index Mistakes
The following stochastic oscillator errors must be avoided:
- Failure to identify the trend – Stochastic works best in range-bound markets.
- Using a single indicator – Use it in combination with MACD, RSI, or Bollinger Bands.
- Every crossover trading – All these signals are not good. Look for confirmation.
FAQs
What is the optimal setting of the stochastic oscillator?
The general setting (14, 3, 3) works well for most traders, but for faster signals, try 5, 3, 3.
How useful/accurate is the stochastic oscillator indicator?
It works well if combined with trend confirmation and other indicators.
Can the stochastic strategy be utilized in isolation without combining it with other indicators?
Yes, but it is best used together with moving averages or MACD.
How is stochastic RSI different from normal stochastic?
Stochastic RSI quantifies its momentum, while normal stochastic RSI seizes the price momentum.
Is the stochastic oscillator apt for trading crypto?
Definitely! A good default setting is anywhere from 5,3,3 because high volatility is the norm in the crypto market.
Final Thoughts
The stochastic oscillator is a prominent indicator of momentum switch and trade reversal. Whether you trade forex, stocks, or cryptocurrency, learning how to utilize stochastic divergence, overbought/oversold, and crossovers can help you make finer trading decisions.


0 Comments