
Why Economic Indicators Matter to Investors Like You
Visualize a setting in which a person is on a peaceful evening happening at that moment to be scrolling through a trading app by choice, paying attention to the stock market live. In no time, there is a sudden change in stock prices: what went wrong? In most cases, economic indicators are the ones to watch. These statistics are not just exaggerated numbers; they are the economy’s lifeline and, to a certain extent, the stock market.
Regardless of whether you are a beginner on the best online trading platforms or already in the race to create an established portfolio of high dividend stocks, knowing how economic indicators affect stocks can certainly be a game-changer in your investment journey.
What Are Economic Indicators?
The economic indicators are just like a roadmap that tells you where the economy will be in the next few months or so. The policymakers, the businesses, and the investors are the personal consumers of the economic indicators, and they are essential for the decision-making process. However, not all the indicators are as important as the others.
Types of Indicators:
- Leading Indicators: These are the predictors of the direction of the economy such as building permits, the business sector’s stock market trends, and business inventories.
- Lagging Indicators: The trends in these indicators are confirmed after they occur, like unemployment rates or corporate profits.
- Coincident Indicators: These kinds of indicators are the best reflection of the current economic condition, such as retail sales and GDP.
If you have ever paid attention to the rally or the dip of any sector while checking your trading stocks, you must have seen that behind this change, the news, published recently, of economic indicators is very often.

The GDP Effect: Measuring Economic Health
Gross Domestic Product (GDP) is the most common indicator of economic health. The GDP represents the sum of all goods and services produced in a country.
Why GDP Matters to Stocks:
- Growth Mode: Rising GDP numbers mark a thriving economy. This drives stock prices, especially in the cyclical industries like construction and luxury goods.
- Recession Warnings: A declining GDP usually sets off a sell-off, which hurts even those companies that pay dividends.
For instance, India’s GDP growth has historically benefited companies in IT and pharmacy. On the other hand, using GDP as an economic parameter of growth allows the investor to be on the lookout for stocks to buy that benefit from the systematic expansion phases.

Inflation: The Silent Killer of Purchasing Power
Inflation serves as the sword of Damocles for the share market. If the inflation is mild, it can help the economy to grow, but if it persists, it can destroy the ability of consumers to buy products.
Impact on Stocks:
- Winners: Companies such as those in the food and personal care, and oil sectors that are able to pass on the cost to the consumers tend to be the best performers.
- Losers: High inflation, on the other hand, has a demoralizing effect on the growth sectors like technology that prioritize profitability in the long run.
If you are looking for the top dividend payers on the best trading platform, it might not be a bad idea to count inflation too. These stocks often act as a hedge because of their steady payouts.
Platforms like Zerodha provide real-time tools to track inflation-related market changes.
Interest Rates: The Cost of Borrowing
In the stock market, interest rates are the primary thing to be regulated by central banks.
When Rates Rise:
- Businesses have to borrow more and more, which would lessen their growth.
- The tendency of investors to use bonds, which are safe and fixed-yield securities, reduces their attraction to doing stocks.
When Rates Fall:
- Firstly, the overall cost of borrowing is decreased, which means that cash-flow-positive firms can be encouraged to expand by means of inward investment. With causative factors such as low interest rates and highly liquid markets, in addition to increased savings, companies use the funds on stock buybacks.
- Also due to their stability in returns, dividend-paying stocks are becoming popular.
Upstox is a good platform for the starters as it provides a great deal of Central Banks’ like this content, which greatly affect the stock market investment strategy.
Employment Data: A Pulse on Economic Activity
Consumer spending is heavily influenced by employment data, as it is a great sector of GDP.
Why It Matters:
- High Employment: This indicates the economy is in a dynamic phase; supply in areas like retail and real estate will be boosted.
- Low Employment: Incomes are hardly disposable; hence, voluntary spending is affected.
When the unemployment data is released, you can often see the stock market respond quickly to it.
Consumer Confidence: The Market’s Sentiment Indicator
The Consumer Confidence Index, which is a major market indicator, shows the public’s view of the economy. It is similar to measuring the market’s mood.
Impact on Stocks:
- High Confidence: It indicates consumers’ tendency to spend freely, hence leading to an upturn for IT, media, and travel stocks.
- Low Confidence: The other hand indicates users are more careful, and they likely prefer more defensive industries like health care.
Platforms like Alice Blue will help you to track customer confidence indices and fine-tune your investment strategy.
Trade Data: Balancing Exports and Imports
Trade data is a metric that indicates a country’s economic relationships with the rest of the world. A trade surplus (when a country exports more than it imports) has always been a positive indicator for the market.
Stock Market Effects:
- Favorable trade data usually results in a rise in export-led industries such as IT and pharmaceuticals.
- A trade deficit might weigh down the currency and make it a less attractive market.
Many export-oriented companies that are sometimes traded on platforms such as Paytm Money can be great investment opportunities if the trading conditions are good.
Corporate Earnings: The Real Test of Value
Earnings reports are equivalent to report cards for companies. Stock prices are influenced by them, and they are closely related to economic indicators.
What to Watch:
- Revenue and profit growth: Positive outcomes tend to stimulate stock rallies.
- Forward guidance: Illustrates future expectations regarding performance.
If you are following penny stocks to buy or dividend stocks, earnings reports are the most significant events. Platforms like Zerodha make it simple to evaluate these metrics.
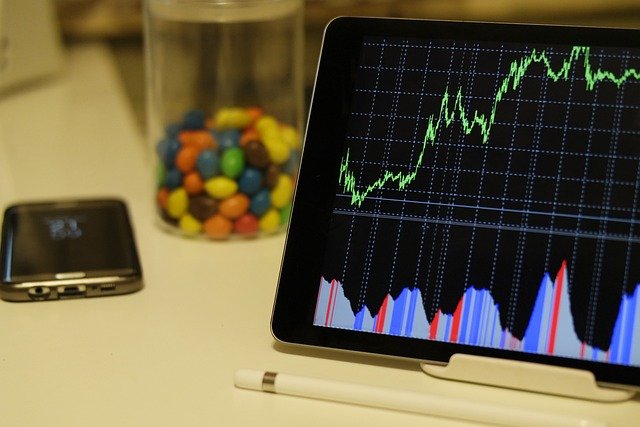
Stock Market Graphs: Visualizing Trends
Stock market graphs weren’t created for mere decoration; they are incredibly useful tools in examining the pattern in market activities.
| Indicator | Impact on Stocks | Example |
| GDP Growth | Boosts stock prices | IT, Pharma |
| High Inflation | Dampens growth stocks | FMCG, Real Estate |
| Trade Surplus | Boosts export-heavy stocks | Automobiles, Textiles |
It can become better at reading stock market graphs on the most efficient online trading platforms, which is an essential element of trading.
How to Use These Indicators on the Best Trading Platforms
These features can be found in platforms such as Zerodha, Upstox, Alice Blue, and Paytm Money to analyze the various economic indicators. The procedures to make the best use of the features are below:
- Real-Time Data: Compare the performance of stocks and sectors from emerging sources.
- Customizable Alerts: Create alerts for drastic changes in indicators such as GDP or interest rates.
- Educational Resources: Make use of the in-app tutorial to learn more about these indicators.

Investing Strategies Based on Indicators
Now that you have a hold on these indicators, let’s look into how to apply them in the stock market for your investment:
Growth Stocks:
- Suitable during economic expansions (high GDP and consumer confidence).
- Identify fast-growing companies using tools on platforms like Upstox.
Dividend Stocks:
- Protection for the shareholders during uncertain economic times (stable payouts).
- Choose the app that the users have found to have the highest yield.
Penny Stocks to Buy:
- Considered a high-risk, high-reward kind of investment during bullish trends.
- Conduct exhaustive research to avoid traps of volatility.
Conclusion: From Data to Dollars
It may be immense to understand economic indicators, but they are necessary, as they help one to decide which stocks to buy. To analyze stock market graphs on the best trading platforms and decide between high dividend stocks and penny stocks, economic indicators will help you like a leading light.
In order to refine your investment techniques and strategies, make an effort through fundamental analysis to spot the undervalued stocks, or conduct more detailed readings in the sector analysis to find out industries with the highest potential for growth. Moreover, being familiar with the financial statements, like the balance sheets and income statements, will give you the background for assessing the performance of the companies.
By using knowledge acquired paired with tools available on the platform, such as Zerodha, Paytm Money, or Alice Blue. You’ll be able to navigate the market and know where to trade confidently.
FAQs
What economic indicators to rely on the most when trading?
The impact of the stock market is determined largely by such economic indicators as GDP, inflation, and employment data.
How do I track economic indicators?
Platforms like Upstox or any government reports will provide reliable data.
Can economic indicators be used to predict stock prices?
Economic indicators are valuable, but they do not necessarily guarantee future performance. They are just a guide.
Which is the best trading app for beginners?
Besides having many educational tools available, Paytm Money and Zerodha are also trying to make their platforms user-friendly, which makes a huge difference.
Do economic indicators affect all types of stocks equally?
No, growth stocks, dividend stocks, and penny stocks react differently based on the indicator.


0 Comments