Bollinger Bands helps to analyze the overbought or oversold position of the market using the method of traders…

Bollinger Bands: Volatility-Based Trading
read more
Bollinger Bands helps to analyze the overbought or oversold position of the market using the method of traders…
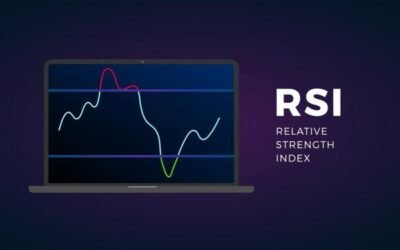
The Relative Strength Index (RSI) is one of the reliable tools a trader uses meaning that one of the tools most traders can rely….

CPR is the one that indicates the price first and not the one that does it after giving us the assistant…..
MACD is the abbreviation for Moving Average Convergence Divergence which is a contextual method with….

A moving average (MA) is a stock indicator that averages the price of an asset to the specific period in….

The inquiry is whether you understand the essence of open interest and its importance. Open interest (OI) denotes the cumulative….

Option Greeks are mathematical scripts used to determine how the option price is influenced…

Technical analysis may initially appear daunting for beginners, but it is mainly about recognizing the pattern by which prices rise….

Income tax is a direct tax paid to the government by the individuals and companies present in that country….